The chart below shows the changes in ownership of electrical appliances and the amount of time spent doing housework …
The chart below shows the changes in ownership of electrical appliances and the amount of time spent doing housework …
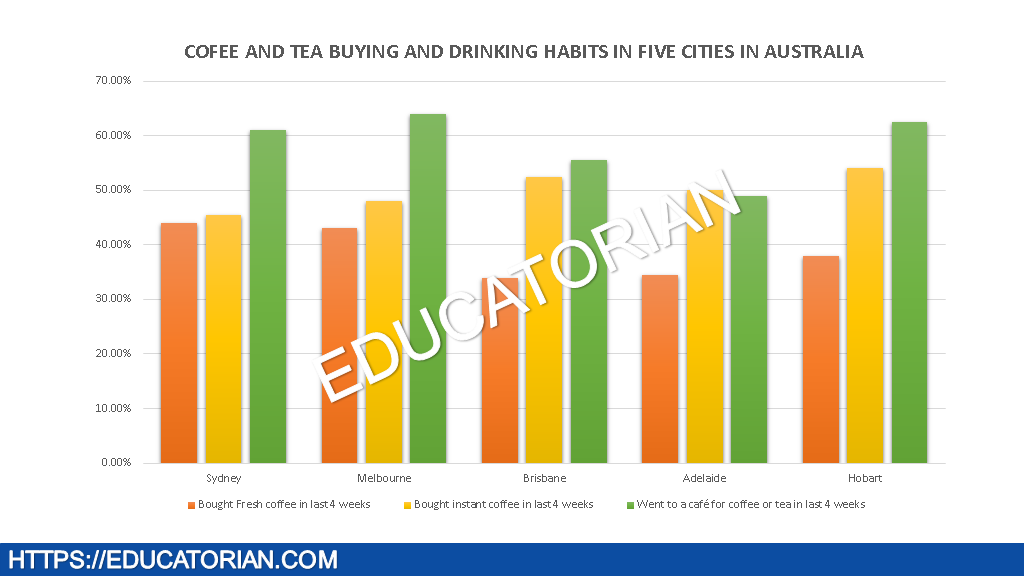
The chart shows the result of a survey about people’s coffee and tea buying and drinking habits in five Australian cities.

It is said that getting a good job requires having a degree, while others claim experiences after high-school are better. Read to check my answer

IELTS Writing Academic Task 1 – Automatic Photo Booth – The diagram below shows an automatic photo booth. Read my answer to learn more.

IELTS Writing: As countries develop, their populations tend to live individually or in small family units. What are the causes of this trend and what …

The chart below gives information about global population percentages and distribution of wealth by region. Read the model answer…..

Some people believe that teaching children at home is best for a child’s development while others think that it is important for children to go to school. Discuss the advantages of both methods and give your own opinion.

IELTS Task 1 : Letter Writing You have just spent a week with a friend on holiday. When you got home, you realized you had left your wallet there. Write […]

IELTS General Training Task 2 Celebrities: Do you think that being a celebrity brings more benefits or more problems? Check my version.
The first chart below shows how energy is used in an average Australian household. The second chart shows the greenhouse… Read my IELTS answer here.