IELTS Writing Academic Task 1: Line Graph – Electrical Appliances
IELTS Writing Task 1 Academic
You should spend about 20 minutes on this task.
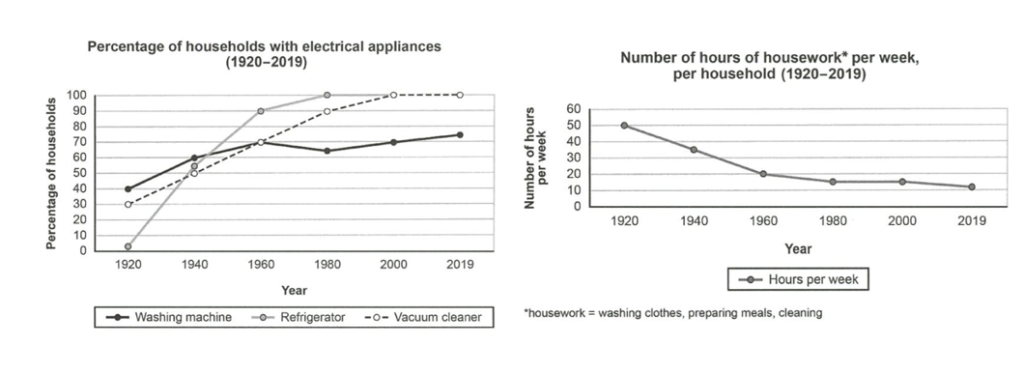
The chart below shows the changes in ownership of electrical appliances and the amount of time spent doing housework in households in one country between 1920 and 2019.
Summarise the information by selecting and reporting the main features, and make comparisons where relevant.
Write at least 150 words.
Version 01:
The first line graph compares the percentage of households with certain electrical appliances from 1920 to 2019, while the second graph shows the total number of hours spent on housework. Overall, there was a decrease in the number of hours spent on household chores throughout the decades, accompanied by an increase in the ownership of appliances.
In 1920, only two electrical appliances, a washing machine with an ownership rate of 40% and a vacuum cleaner with an ownership rate of 30%, were available. On average, households spent 50 hours per week on housework. However, after two decades, there was a decrease in the number of hours spent on household chores, while the ownership of appliances increased. Almost half of the population owned a refrigerator, while the other two appliances saw a 20% increase in ownership.
By 1980, all households had a refrigerator, and this trend continued for the following decades, while it took two more decades for the vacuum cleaner to become a staple appliance in every household. In 2019, the number of hours spent on household chores had dropped to 10 hours per week, and 70% of households had a washing machine.
166 words
Version 02:
The first line graph compares the percentage of households with certain electrical appliances from 1920 to 2019, while the second graph compares the total number of hours spent on housework. Overall, the popularity of refrigerators and vacuum cleaners surpassed that of washing machines, and there was a significant decrease in the number of hours spent on house chores.
In 1920, four in ten households had washing machines, while only three in ten had vacuum cleaners. Over the next two decades, the ownership rate of vacuum cleaners increased by 20%. In the same year, almost half of the population had a refrigerator. By 1980, all households had a refrigerator, while it took another two decades for vacuum cleaners to become widely available. In 2019, all households had refrigerators, while seven out of ten households had washing machines and vacuum cleaners.
The number of hours spent on household chores such as laundry, meal preparation, and cleaning steadily decreased from 50 hours per week in 1920 to only 10 hours per week in 2019.
171 words
Source Cambridge 16
Edited by Ian Tanpiuco

Ian Tanpiuco is an ESL and virtual assistant. With a decade of experience, he has become an expert in his field. Dedicated to helping others achieve their goals, Ian works tirelessly in the classroom or as a virtual assistant.