The two maps below show road access to a city hospital in 2007 and in 2010. Check the two suggested essays to learn more.

The two maps below show road access to a city hospital in 2007 and in 2010. Check the two suggested essays to learn more.

Writing Task 1 You should spend about 20 minutes on this task. The graph below gives information from a 2008 report about the consumption of energy in the US since […]
The diagram below shows the process of recycling plastic bottles. Summarize… Check this post to view two answers.
The chart below shows the changes in ownership of electrical appliances and the amount of time spent doing housework …

What is your favorite TV program/show? (Why?). Cambridge 13 – Test 1 – Here are some answers. Read to learn more.

IELTS Speaking: IELTS Speaking: where do you usually watch TV programs/shows? – Cambridge 13 – Test 1 – Read to learn more.
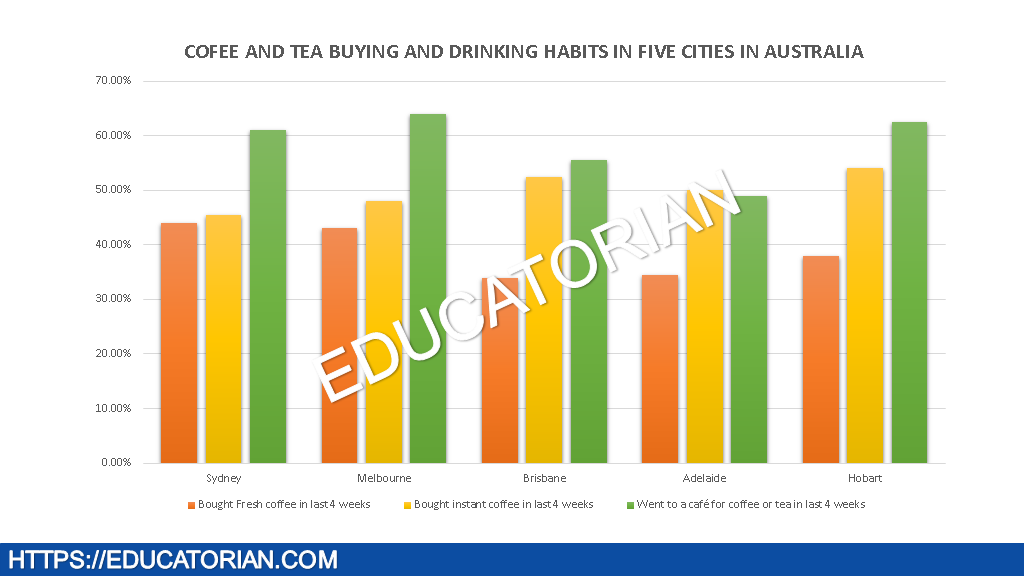
The chart shows the result of a survey about people’s coffee and tea buying and drinking habits in five Australian cities.

It is said that getting a good job requires having a degree, while others claim experiences after high-school are better. Read to check my answer

IELTS Writing Academic Task 1 – Automatic Photo Booth – The diagram below shows an automatic photo booth. Read my answer to learn more.

IELTS Writing: As countries develop, their populations tend to live individually or in small family units. What are the causes of this trend and what …