")
IELTS Task 1 – Goods Transported in the UK (1974 to 2002)
IELTS Task 1 – Goods Transported in the UK (1974 to 2002)
The graph below shows the quantities of goods transported in the UK between 1974 and 2002 by four different modes of transport. Summarise the information by selecting and reporting the main features, and make comparisons where relevant.
Write at least 150 words
Date Type: Line Graph
Time: (Past tense)
Vocabulary
- Quantities – Amount, loads
- Goods – products, merchandise, commodities, supplies.
- Transported – delivered, hauled, shipped, moved, conveyed, and carried.
- Different modes of transport – various means of transportation, different forms of transportation, and a variety of transport systems.
- Range of transportation methods.
- Road – ground transport, roadway, over land, surface/land transportation, highway transport
- Water – maritime transport, waterborne transport, waterway transport
- Rail – train, railroad, track transport, rail transit, rail service,
- Pipeline – conduit, pipe-based,
Version 1 : IELTS Task 1 – Goods Transported in the UK (1974 to 2002)
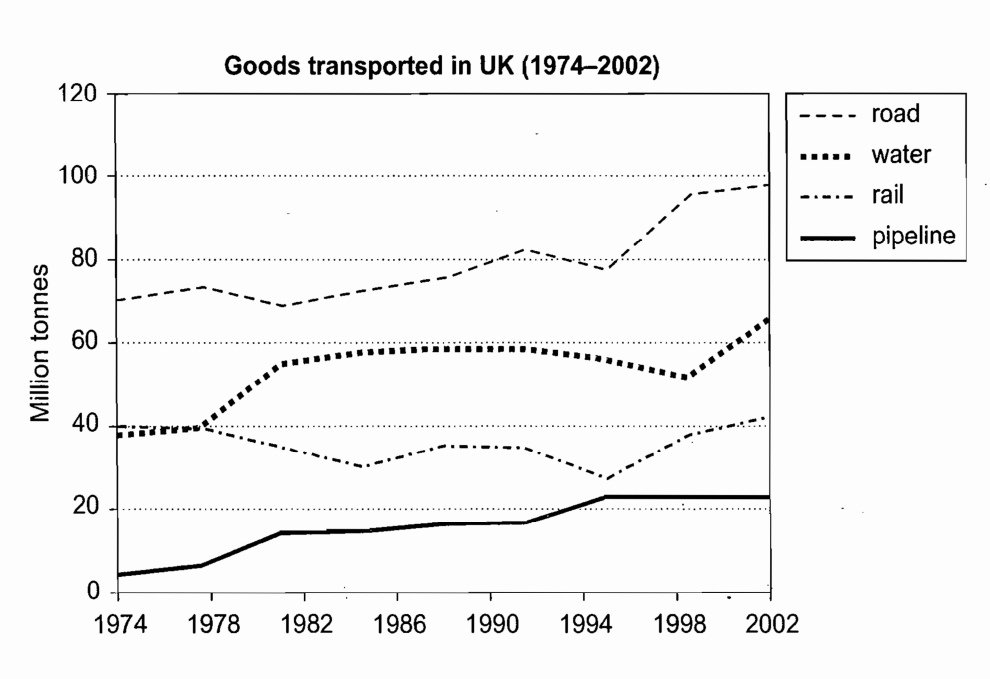
The line graph compares the commodities shipped in the UK from 1974 to 2002 by using various means of transportation. Overall, road transit was the most used mode of transportation while the pipeline was the least.
Water and Rail transports were at the same level from 1974 to 1978, amounting to 40 million tons of cargo. After that, these two parted ways, and by 1982, maritime transport reached 60 million tons while train transport declined to 35 million tons. Although there was dropped in the number of shipments for rail in 1984 and 1995, it managed to increase up to 40 million in 2002 while water soar to 62 million tons that same year.
Only a few shipments were made using pipelines in 1974 with only 5 million tons of goods transported in the UK compared to land transport which carried 70 million tons the same year. Although pipe-based transport has less cargo it has a steady growth throughout the years and it reached 20 million tons by 2002, and highway transports shipped almost 100 million tons by 2002.
Version 2: IELTS Task 1 – Goods Transported in the UK (1974 to 2002)
The line graph compares the commodities transported in the UK from 1974 to 2002 via various modes of transportation. Overall, road transportation was the most widely used mode, while pipeline transport was the least utilized.
In 1974, road transport was responsible for approximately 70 million tons of goods transported into the UK, while 40 million tons were shipped by both water and rail, and pipeline transport was the smallest with only 5 million tons. Rail and water transport held steady in terms of shipments until 1978, while the other two modes experienced slight increases. By 1986, road transportation had risen back up to 70 million tons, while rail transport had increased to 60 million tons and water transport had decreased to 35 million tons, and pipeline transport remained at 18 million tons.
In 1990, road transport had managed to ship 80 million tons, while the other three modes remained at the same shipment level. Five years later, pipeline transport increased to around 20 million tons of cargo transported into the UK and remained stable in 2002. Water and rail transport reached 60 million and 40 million tons, respectively, and road transport reached 90 million tons after experiencing a downward trend in 1995.
Check my other IELTS Writing.
Check my website.

Ian Tanpiuco is an ESL and virtual assistant. With a decade of experience, he has become an expert in his field. Dedicated to helping others achieve their goals, Ian works tirelessly in the classroom or as a virtual assistant.