Writing Task 1 You should spend about 20 minutes on this task. The graph below gives information from a 2008 report about the consumption of energy in the US since […]
Writing Task 1 You should spend about 20 minutes on this task. The graph below gives information from a 2008 report about the consumption of energy in the US since […]
The diagram below shows the process of recycling plastic bottles. Summarize… Check this post to view two answers.

Here you will find a detailed list of what you will be able to do by the end of your A1 level course. Check this post to learn more.
Good day to all students, starting January 30, 2022. TOEIC Listening and Reading test will be made. Kindly read to know more.
The chart below shows the changes in ownership of electrical appliances and the amount of time spent doing housework …
This grammar lesson is about how and when to use Present Continuous. The common structure. When and how to use it. Read to learn more.

What is your favorite TV program/show? (Why?). Cambridge 13 – Test 1 – Here are some answers. Read to learn more.

IELTS Speaking: IELTS Speaking: where do you usually watch TV programs/shows? – Cambridge 13 – Test 1 – Read to learn more.
It is more important to work at a job you enjoy than to make a lot of money. Support your answer with specific reasons and examples.
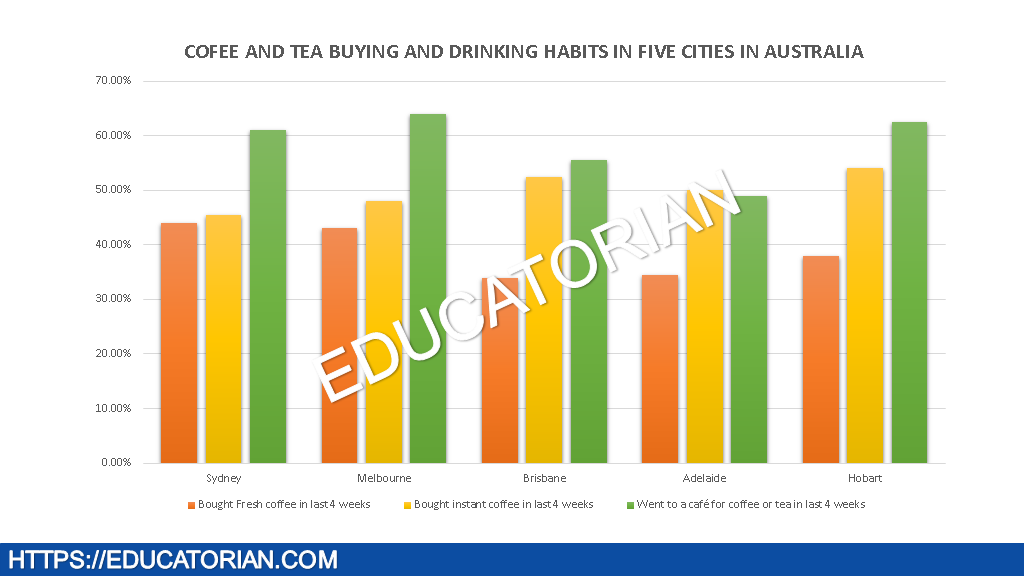
The chart shows the result of a survey about people’s coffee and tea buying and drinking habits in five Australian cities.