The chart shows the result of a survey about people’s coffee and tea buying and drinking habits in five Australian cities.
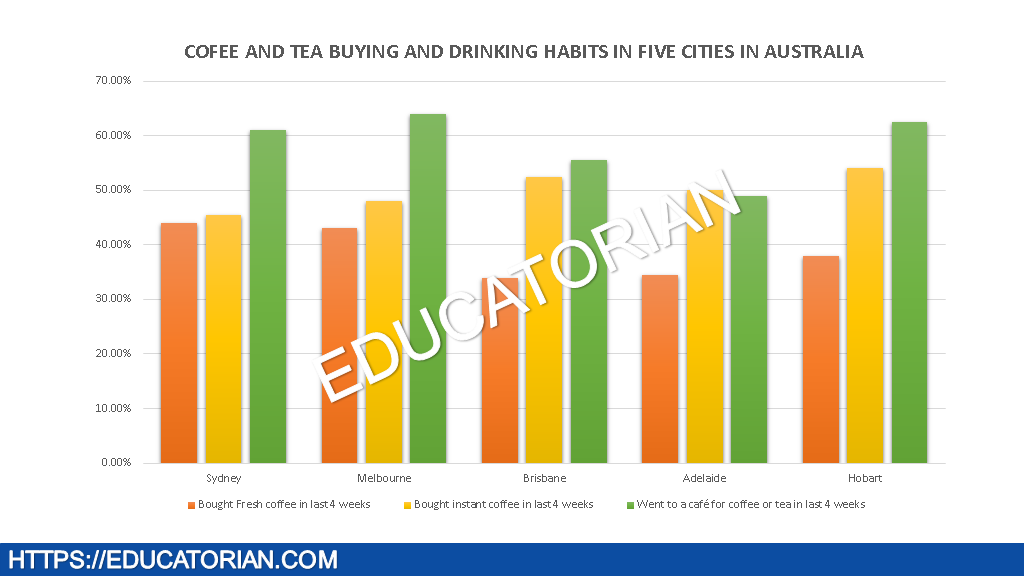
The chart shows the result of a survey about people’s coffee and tea buying and drinking habits in five Australian cities.

IELTS Writing Academic Task 1 – Automatic Photo Booth – The diagram below shows an automatic photo booth. Read my answer to learn more.
The chart below gives information about global population percentages and distribution of wealth by region. Read the model answer…..
For my students who are submitting their work online, kindly use this IELTS and TOEFL writing answer sheet. Write your task1 and task2.

You should spend about 20 minutes on this task.The chart below shows how frequently people in the UK ate fast food restaurants between 2003 and 2013,,,

IELTS Task 1: The graphs above give information about the total number of order per dish in an Indian Restaurant in the UK from 2008 and 2011. Summarize the information by selecting and reporting the main features, and make comparisons where relevant. Write at least 150 words.