IELTS Academic Task 1: Fast Food
IELTS Task 1
You should spend about 20 minutes on this task.
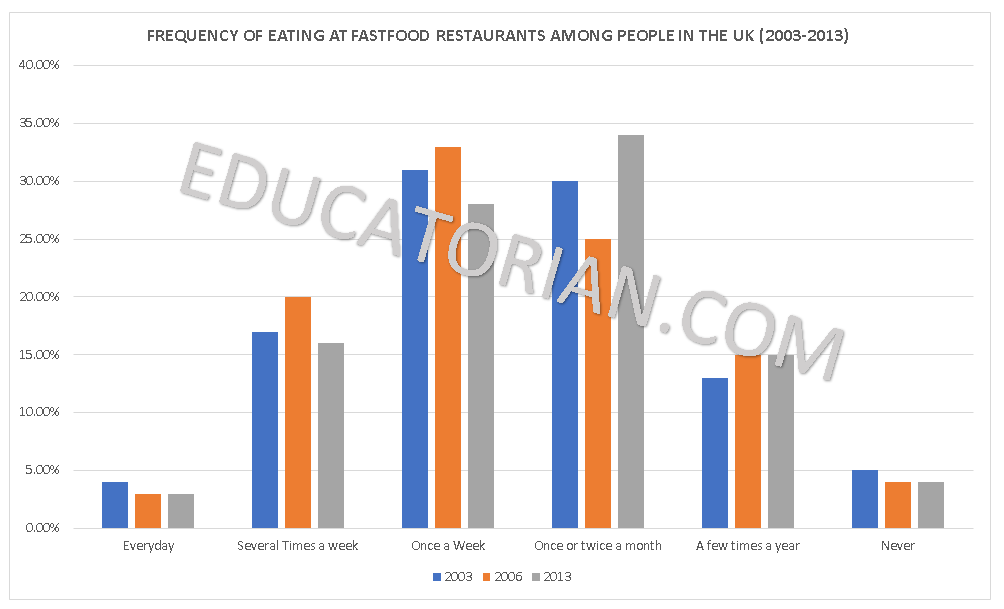
The chart below shows how frequently people in the UK ate fast-food restaurants between 2003 and 2013. Summarize the information by selecting and reporting the main feature, and make comparisons where relevant.
VERSION 01: X-AXIS
The bar graph compares the frequency of consumption of fast-food by the people in the UK from 2003 to 2013. Overall, there were only a few percentages that had fast-food daily while the rest were not as frequent.
In 2003, only 4% had chosen to eat in fast-food every day while 5% decided not to eat in fast food. People who ate several times a week were quite close to the percentage of people who just ate a few times a year by 4%, 17%, and 13% respectively. Almost one-third of the population preferred to have a meal once a week, a similar pattern to people who had fast-food meals once or twice a month.
After five years, the number of people who ate every day and who never ate decreased by a percent then a fifth of the people decided to have fast food several times a week which was an increase of 5% taking out from the people who ate once or twice a month. An increase of 3% for both customers who prefer to have a weekly meal and a few times per year in a fast-food accounting for 33% and 15% respectively.
By 2013, the trends were similar to the daily patrons, customers who visited few times a year and non-customers from 2006 while a decreased of 4% for both weekly customers who visited several times a week and once a week customer. Customers who prefer to have a meal once or twice a month increased by 8%.
253 Words
VERSION 02: Y-AXIS
The bar graph compares the percentage of frequency of customers in fast-food restaurants in the UK from 2003 to 2013. Overall, almost half of the percentage of people choose to have fast-food in their diet only once a week or a couple of times per month.
Around 4%of the population has chosen to have fast-food as part of their daily diet in 2003 while only 4% of the population had chosen not to eat fast-food in 2003 and by 2013 only 4% still continued this practice and 3% for people who ate fast-food daily. People who ate in a fast-food several-times a week increased from 17% to 20% in less of a five-year span, however, this decreased by 2013 which is a similar pattern to people who had fast-food in a weekly basis.
Customers who chose to have fast-food at least a few times a year only increased by 3% from 12% to 15% and this trend remained until 2013. A third of the population decided to have fast food at least once or twice a month in 2003 and after five years, this was decreased but immediately bounced back at 34% by 2013.
195 Words
Check other IELTS writing
Check my blog

Ian Tanpiuco is an ESL and virtual assistant. With a decade of experience, he has become an expert in his field. Dedicated to helping others achieve their goals, Ian works tirelessly in the classroom or as a virtual assistant.