IELTS Academic Writing Task 1: Line Graph National Park
WRITING TASK 1
You should spend about 20 minutes on this task.
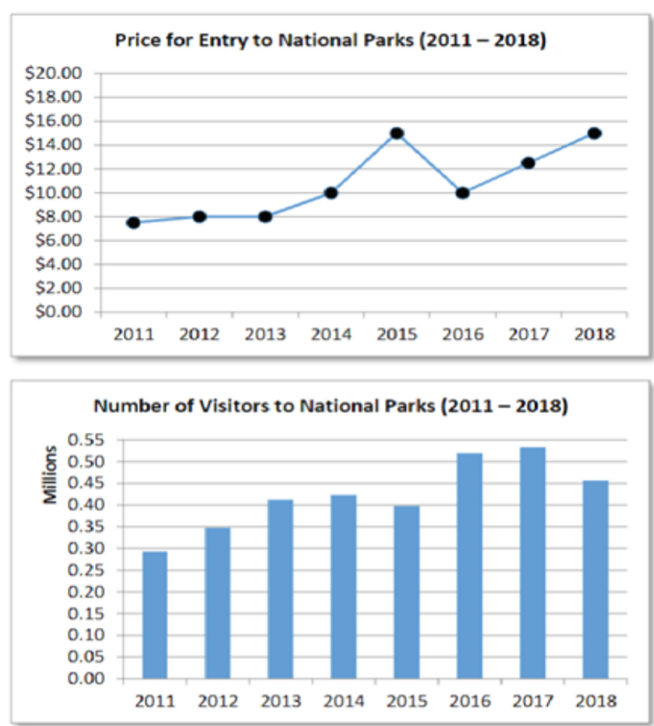
The charts below show changes in the cost of visiting a national park in the country from 2011 to 2018 as well as the number of visitors to national parks each year.
Summarise the information by selecting and reporting the main features, and make comparisons where relevant. Write at least 150 words.
Version 1
The line graph shows the price for entry to National Parks while the bar graph shows the number of visitors in from 2011 to 2018. Overall, within eight years the price doubled, however, the number of guests was relatively low.
In 2011, almost 300,000 visitors came to the national park and guests continued to increase for the next two years, while the entry price of $8.00 remained the same these years. By 2014, the national park impose an additional $2.00 increase, and the number of visitors reached 400,000, a third of an increase within a year.
In 2015, the entrance fee increased to $15.00, and the number of visitors slightly decreased, but after reverting to the previous price of $10.00, the guests count skyrocketed to half a million in 2016. Although the price increased again by $2.00 just after a year the movement of patrons continued to move upward, but a reduction of 50,000 guests happened in 2018 upon reinstating the $15.00 entrance fee.
Version 2
The line graph compares the entrance fee of the National park while the bar graph shows the number of visitors from 2011 to 2018. Overall, the price doubled within the span of eight years while there was no significant increase in guests.
National Park’s entrance rate accounted for $8.00 in 2011 and it remained the same for the next two years until the park decided to impose a $2.00 increase, and this price remained until 2016 with the exception of 2015 when it jumped to $15.00. By 2018, the entry fee revert to $15.00 a $3.00 increased compared to last year.
The number of visitors in 2011 accounted for around 300,000 and continued to increase by 50,000 every year until 2013. After two years the number of patrons declined to 400,000, 20,000 less compared to last year. This number was revitalized, accepting half a million in 2016 and another increase of 25,000 the following year, but it suddenly plummeted back to 450,000 in 2018.
Check my other IELTS Writing.
Check my website.

Ian Tanpiuco is an ESL and virtual assistant. With a decade of experience, he has become an expert in his field. Dedicated to helping others achieve their goals, Ian works tirelessly in the classroom or as a virtual assistant.