IELTS Writing: Weekly Family Income
Writing Task 1
You should spend about 20 minutes on this task.
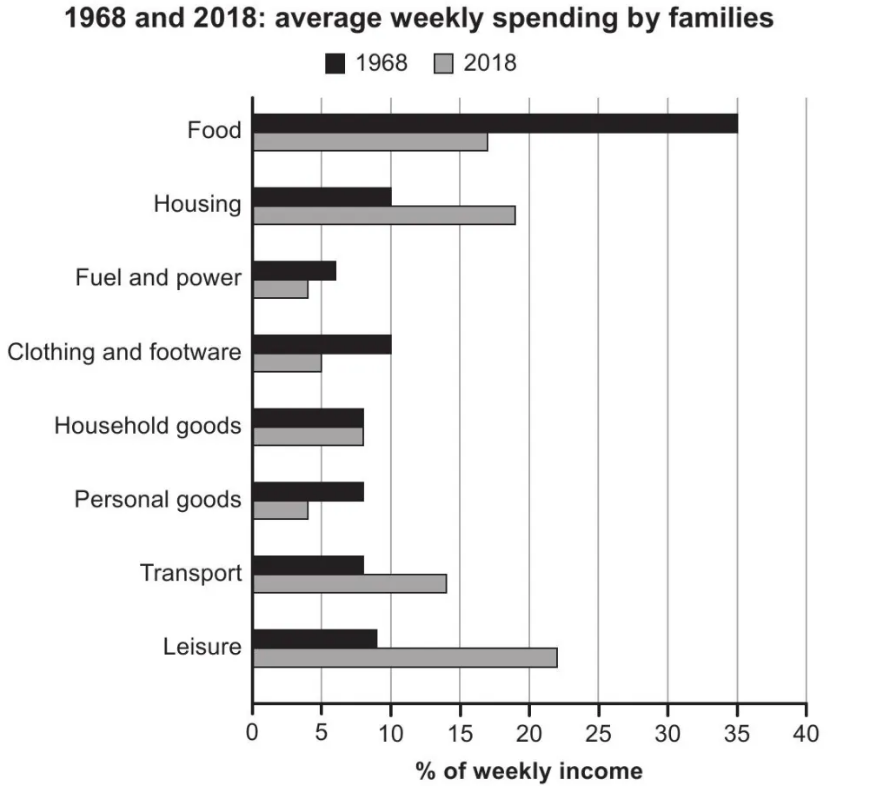
The chart below gives information about how families in one country spent their weekly income in 1968 and in 2018.
Summarise the information by selecting and reporting the main features, and make comparisons where relevant.
Write at least 150 Words
Weekly Family Income: Version 1
The bar graph compares the weekly expenditure of families in 1968 and 2018. Overall, food had a significant percentage of the families’ costs, which shifted after fifty years, while housing and leisure expenses doubled.
Almost a third of the income was spent on food in 1968, while housing and clothing, including footwear, were about the same percentage, accounting for 10% each. Spending on household goods and personal goods was a bit less compared to transport and leisure which were 8%, and 9% respectively. Only 6% of their income was spent on fuel and power.
After fifty years, expenditure allocation changed; 16% was spent on food which is 3% less than housing. More than a fifth of the income was for leisure expenses, and transport reached 14%. Personal goods and clothing & footwear expenses were cut in half after fifty years while household goods remained the same. Fuel and power decreased by 2%
Weekly Family Income: Version 2
The bar graph compares the different weekly expenditures percentages of families in 1968 and 2018. Overall, food had a higher rate, but after five decades, leisure and housing had more allocation on their budget.
In 1968, thirty-five percent of the families’ income was spent on food weekly, but it was reduced to half in 2018; a similar pattern with clothing and footwear expenses from 10% to 5%, respectively. The budget for fuel and power was the lowest with only 6% in 1968, and it decreased by 2% in 2018. Personal goods dropped from 8% to 4% while there were no changes for household goods.
Housing, which was only 10% of the families’ weekly expenses, increased to 19% in the last five decades. Weekly costs on transport increased to 14%, a 6% increase. Leisure which was only 8% in 1968, doubled in 2018, reaching 22%, which makes it the highest expenditure in 2018.
Check other Writing

Ian Tanpiuco is an ESL and virtual assistant. With a decade of experience, he has become an expert in his field. Dedicated to helping others achieve their goals, Ian works tirelessly in the classroom or as a virtual assistant.