IELTS Academic Writing Task 1: US Energy Consumption
Writing Task 1
You should spend about 20 minutes on this task.
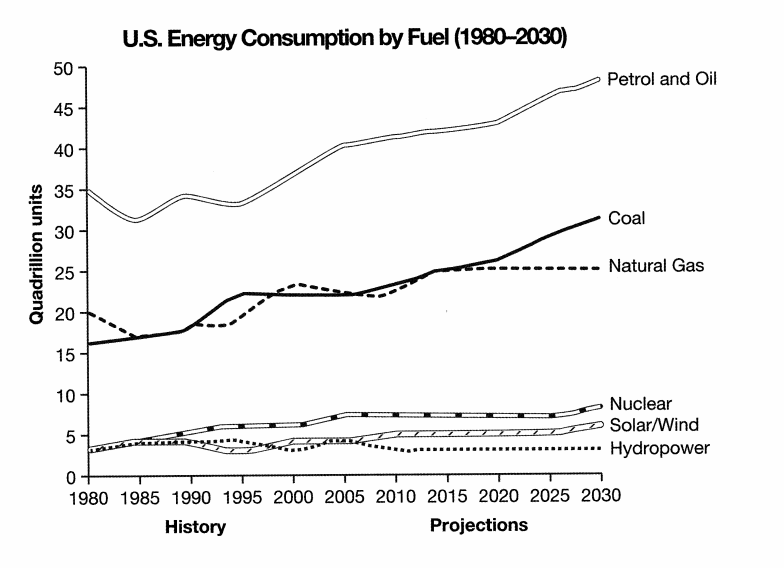
The graph below gives information from a 2008 report about the consumption of energy in the US since 1980 with projections for 2030.

Summarize the information by selecting and reporting the main feature and make comparisons where relevant.
Write at least 150 words.
Version 01: Y-Axis
The line graph compares the six different sources of fuel in the United States and its consumption from 1980 and its projection until 2030 made in 2008. Overall, Petrol and Oil will be the highest energy source while Solar/Wind and Hydropower to remain steady.
In the US, Petrol and Oil recorded the highest source of energy consumption amongst the six, accounting for 35 quadrillion units in 1980. Although there was a slight decrease in 1985 and 1995, it remained the highest, and by 2030 it is projected to reach 50 quadrillion units.
Natural Gas and Coal were in second and third place for energy utilization accounting for 20 and 15 quadrillion units in 1980, and by the following years, these two sources raced to be in second place. Coal usage will double by 2030, while natural gas use will increase by five quadrillion units.
Nuclear, Solar/Wind, and Hydropower started around four quadrillions in 1980 and remained constant until 1990. Nuclear power output peaked at seven quadrillions in 2010, and it is predicted to remain stable through 2030. Solar/wind and hydropower were projected to be around five and four quadrillion units, respectively, indicating that these two are the least used energy sources in the US.
Version 02: X-Axis
The line graph compares the 2008 report about the different energy consumption by fuels in the US from 1980 until 2030. Overall, within five decades, Petrol and Oil will be the primary source of power while hydropower will be the least.
In 1980, Petrol and Oil were the highest fuel used in the US, accounting for 35 quadrillion units. Natural gas and goal came in the second and third place, with 20 q and 15 q units accordingly. After five years, a slight decrease happened while the other three energy sources (Nuclear, Solar/Wind, and Hydropower) started to increase slightly around 5 q units.
In 2005, petrol and oil reached 40 q units while natural gas and coal reached the same level of around 23 q units. Solar/Wind and Hydropower remained constant, but nuclear power had reached 6 q units.
In 2030, coal will reach 30 q units and outperform natural gas by 5 q units, while nuclear and solar /wind will remain at the same level. Hydropower is projected at only 3 q units while Petrol and Oil will reach 48 q units.
Source: IELTS Cambridge 09. Test 4
Check other IELTS content here.
Writer – Ian

Ian Tanpiuco is an ESL and virtual assistant. With a decade of experience, he has become an expert in his field. Dedicated to helping others achieve their goals, Ian works tirelessly in the classroom or as a virtual assistant.

