IELTS Task 1 – World Wide Land Degradation
IELTS Task 1 – World Wide Land Degradation
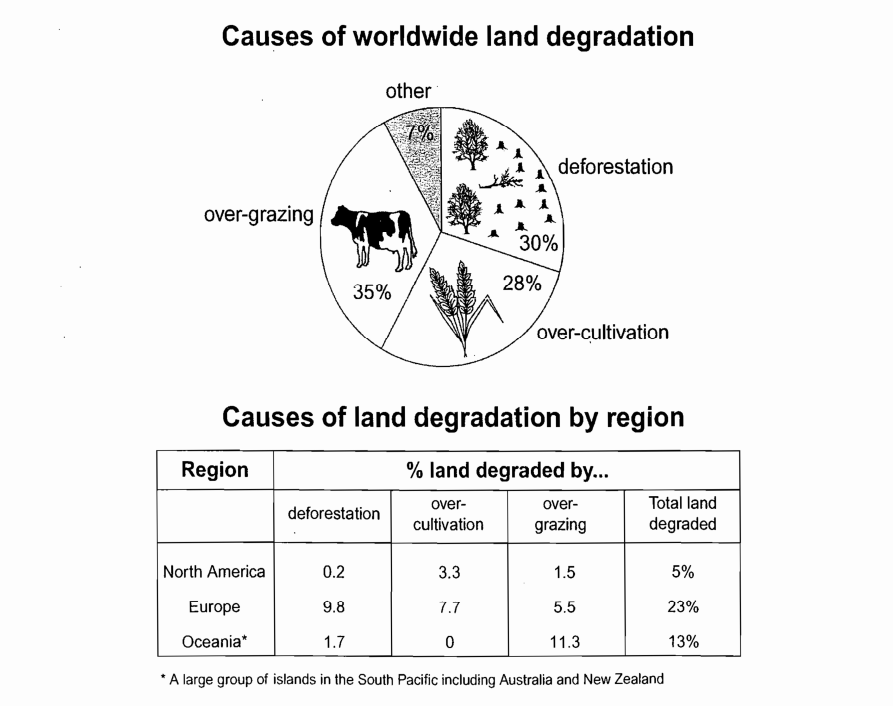
The pie chart below shows the main reasons why agricultural land becomes less productive. The table shows how these causes affected three regions of the world during the 1990s.
Summarize the information by selecting and reporting the main features, and make comparisons where relevant.
Write at least 150 words.
Data
When working on Task 1, it’s important to understand that there are two different versions of the task. In the first version, the focus is on interpreting data presented in the form of a pie chart and a table. In the second version, the focus is on analyzing the causes of land degradation and the specific regions where it is occurring.
When dealing with data, it’s typically best to start with the smallest details and work your way up to the bigger picture. This allows you to gain a better understanding of the data and identify any patterns or trends that may exist.
Vocabulary
When it comes to writing, it’s important to avoid using overused or exaggerated phrases such as “it is obvious” or “it is clear.” While these phrases may seem like a quick and easy way to convey your message, they can actually harm your score and weaken the credibility of your writing.
Instead, try using more precise and accurate language to express your ideas. For example, you could use the phrase “in general” or “overall” to provide a more nuanced and detailed explanation of your point. These phrases can help you demonstrate a deeper understanding of the topic and showcase your critical thinking skills.
In addition, using varied and sophisticated vocabulary can also help improve the quality of your writing. By incorporating synonyms and related terms, you can avoid repetition and make your writing more engaging and compelling.
Overall, it’s important to be intentional and thoughtful in your choice of language when writing. By avoiding cliches and using precise and accurate vocabulary, you can enhance the impact and effectiveness of your writing.
Version 1:
The pie chart compares the various causes of land degradation across the world, while the table shows the affected regions during the 1990s. Overall, over-utilization of land was the main cause of land degradation, with Europe being the region most heavily affected.
More than a quarter (28%) of the world’s land degradation was attributed to the over-cultivation of crops, while a third was caused by extensive logging. The biggest factor was over-grazing which accounted for more than a third (35%).
In terms of regions, North America had the lowest percentage with over-farming affected 3.3% of the land while over-pasturing impacted 1.5%, resulting in a total of 5% of all land being barren. Oceania had the highest percentage of infertile land impacted by over-grazing, totaling 11.3%. When factoring in deforestation, Oceania’s overall land degradation was 13%. In Europe, farmlands were heavily affected, with 23% of its overall land suffering from degradation. Deforestation was the biggest contributor, accounting for 9.8%, while over-cultivation and over-grazing accounted for 7.7% and 5.5%, respectively.
Version 2:
The pie chart compares the leading causes of unproductive land due to soil degradation, while the table provides information on the percentage of affected land by region in the 1990s. Overall, over-usage of land was a significant factor contributing to unproductive land, with Europe’s farmland being the most heavily impacted compared to other regions.
More than a quarter (28%) of global land degradation was attributed to over-cultivation, with 7.7% of affected land found in Europe and 3.3% in North America. Overlogging accounted for 30% of land degradation worldwide, with only 1.7% of affected land in Oceania, a small fraction in North America, and 10% in Europe.
Over-grazing was responsible for more than a third (35%) of land degradation, with 10% of land in Oceania considered over-grazed, while 5% in Europe and 1.5% in North America. In total, nearly a quarter of European land was affected by land degradation, followed by Oceania at 13%.
Check my other IELTS Writing.
Check my website.

Ian Tanpiuco is an ESL and virtual assistant. With a decade of experience, he has become an expert in his field. Dedicated to helping others achieve their goals, Ian works tirelessly in the classroom or as a virtual assistant.