IELTS Task 1 – Academic – Export Earnings
IELTS Task 1 – Academic – Export Earnings
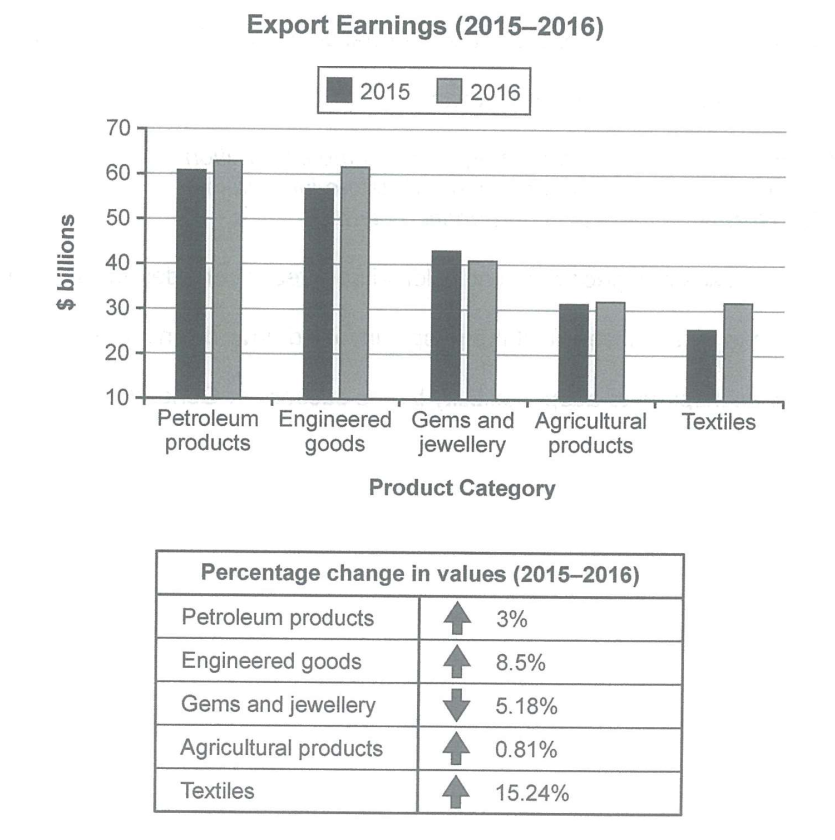
The chart below shows the value of one’s country’s exports in various categories during 2015 and 2016. The table shows the percentage change in each category of exports in 2016 compared in 2015. Summarize the information by selecting and reporting the main features, and make comparisons where relevant.
Introduction – Two Versions
- The bar graph compares the export earnings of a country in 2015 and 2016 while the table shows the percentage of changes in value. Overall, with the exception of Gems and Jewellery, all other exports increase their earnings.
- The bar graph compares the five export earnings of a country in 2015 and 2016, including the percentage change in value. Overall, although Petroleum products were the biggest in earnings, Textiles had the highest in growth.
Version 1
The bar graph compares the five export earnings of a country in 2015 and 2016, including the percentage change in value. Overall, although Petroleum products were the biggest in earnings, Textiles had the highest in growth.
Petroleum products were the highest earnings of all five exports, reaching an annual export earning of USD 60 billion in 2015 and a 3% growth the next year. In second place in both growth and earnings, engineered goods increased by 8.5% reaching USD 62 billion. For agricultural products, only a small fraction of growth was observed with only 0.81% growth in 2016 reaching USD 31.8 billion, putting in third place.
Amongst all exports, Gems, and Jewellery was the only one that declined in 2016, a dropped of 5.18% in revenue earning USD 41 billion. In fifth place, textile export managed to earn USD 31 billion, however, this export had the highest growth accounting for 15.24%.
Version 2
The bar graph compares a country’s export earnings in 2015 and 2016, while the table shows the percentage changes in value. Although petrol products had the highest earnings in both years, textiles had the biggest growth.
For two consecutive years, petroleum products managed to reach the highest earnings accounting for USD 60 and 63 billion in 2015 and 2016, respectively, however with only 3% growth. In comparison with engineered goods, the growth between the two years was noticeable at 8.5% and has a total of USD 62 billion, a billion shorter than petrol while agricultural products had less than a percent growth at USD 31 billion in 2016.
Gems and Jewellery started at USD 42 billion in 2015 but dropped by 5.18%, the only export product that dropped. Despite having a low earning of USD 32 billion in 2016 compared to the other four exports, textiles had the highest growth of 15.24%.
Check my other IELTS Writing.
Check my website.

Ian Tanpiuco is an ESL and virtual assistant. With a decade of experience, he has become an expert in his field. Dedicated to helping others achieve their goals, Ian works tirelessly in the classroom or as a virtual assistant.